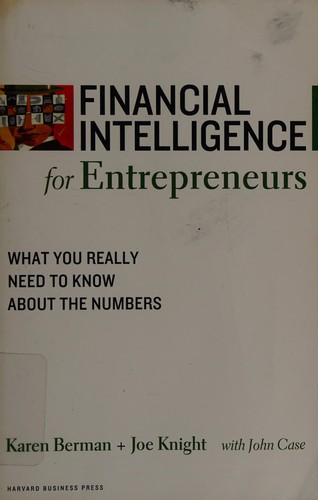
Financial Intelligence for Entrepreneurs
What You Really Need to Know About the Numbers
An entrepreneur who can read the three statements, see the judgment calls inside them, and act on the ratios that follow can ask better questions, manage cash before it runs out, and teach the company to make money on purpose.
A book summary and review by Bruce Eckfeldt
Overview
Financial Intelligence for Entrepreneurs adapts the method of Berman and Knight’s earlier Financial Intelligence for people who start and run their own companies. The authors draw on their Business Literacy Institute training to teach three skill sets. The first is understanding the foundation, meaning the income statement, balance sheet, and cash flow statement. The second is understanding what they call the art of finance. The third is financial analysis.
The book has eight parts and thirty short chapters. It covers the art of finance, the income statement, the balance sheet, cash, ratios, return on investment, working capital, and building a financially literate company. Each part ends with a toolbox. Appendices provide sample financials and exercises drawn from the statements of Under Armour and eBay. The running theme is what the authors call the finance profession’s little secret: accounting numbers rest on estimates, assumptions, and judgment calls, so they reflect reality without being reality.
The final part extends financial intelligence from the owner to the whole company, through training, weekly numbers meetings, scoreboards, and open-book management.
An entrepreneur who can read the three statements, see the judgment calls inside them, and act on the ratios that follow can ask better questions, manage cash before it runs out, and teach the company to make money on purpose.
Chapter Summaries
Chapter 1: What Is Financial Intelligence?
The opening chapter defines financial intelligence as three learnable skill sets and names the obstacles that stop owners from acquiring them.
- The three skill sets are understanding the foundation, understanding the art of finance, and understanding financial analysis. Each builds on the previous one.
- The authors argue that the main roadblocks are fear of math, reliance on accountants, and the feeling that finance is someone else’s job. On math, they note that finance is mostly addition and subtraction, and that ‘when finance people get really fancy, they multiply and divide.’
- The promise is practical. The authors repeat that the book will let the reader ask intelligent questions of accountants and bankers and understand the answers.
Chapter 2: A Primer on the Art of Finance
The chapter shows where the art comes in. Accountants cannot know exactly how long equipment will last or how to allocate every cost, so reported results depend on choices.
- Depreciation is the clearest example. The useful life assigned to an asset sets how much of its cost hits each period, so a change in that assumption moves reported profit without any change in the business.
- Valuation is the other example. Market multiples, discounted cash flow, and asset-based methods can produce very different values for the same company, depending on the purpose and on who is asking.
- The Part One toolbox covers financing the business, weighing debt against equity, and building a finance staff in stages, from bookkeeper to controller to CFO, as the company grows.
Chapter 3: Profit Is an Estimate
The chapter introduces accrual accounting and the matching principle, and explains why the income statement measures profit rather than cash.
- Under accrual accounting, revenue is recorded when the product or service is delivered, not when the customer pays. Costs are matched to the revenue they helped produce.
- The income statement therefore estimates whether the company’s activity was profitable during the period. It does not show how much cash came in.
Chapter 4: Cracking the Code of the Income Statement
The chapter teaches how to read an income statement from top to bottom and what to check before trusting it.
- Before reading the lines, the reader should know what kind of statement it is: actual or projected, for which period, for which entity.
- Reading the statement means comparing lines with prior periods and with plan, then asking what assumptions sit behind the largest movements.
Chapter 5: Revenue
Revenue looks like the most objective line on the statement. The authors argue that the guidelines for when to record it leave wide room for judgment and manipulation.
- Recognition rules are murky for multi-period contracts, bundled products and services, and sales with rights of return. Two honest accountants can book the same contract differently.
- Because revenue drives every number below it, aggressive recognition is a common route to overstated profit. Owners should know when their own company books a sale.
Chapter 6: Costs and Expenses
The chapter separates cost of goods sold or cost of services from operating expenses and shows how classification changes the story the statement tells.
- Cost of goods sold covers the direct costs of producing what was sold. Operating expenses cover everything else needed to run the business.
- Depreciation and amortization are noncash expenses that spread past investments over time. They can be large enough to change how profitable a capital-intensive company looks.
- One-time charges are a yellow flag. A company that takes them every year is reporting a recurring cost as an exception.
Chapter 7: The Many Forms of Profit
Profit shows up on the income statement in three forms, and each answers a different question about the business.
- Gross profit shows whether the product or service itself makes money before overhead. The authors ask how much gross margin is enough to cover the business model’s operating costs.
- Operating profit, or EBIT, is treated as a key to health because it measures how well the business is run before financing and taxes.
- Net profit is the bottom line. It can be improved only by raising revenue, cutting cost of goods, or cutting operating expenses.
- The Part Two toolbox explains variance analysis and the difference between percent-of and percent-change calculations.
Chapter 8: Understanding Balance Sheet Basics
The balance sheet shows where the company stands at a single moment. The authors explain it by comparing it with an individual’s net worth.
- Assets minus liabilities equals owners’ equity, for a household as much as for a company.
- Because the balance sheet is a snapshot, reading it means comparing two dates and asking what changed and why.
Chapter 9: Assets
Most asset values are estimates. The authors walk through each class and the assumptions behind it, with cash as the main exception.
- Receivables are net of an estimate for bad debt. Inventory depends on the costing method. Fixed assets are carried at cost less estimated depreciation.
- Intangibles and goodwill from acquisitions are among the most judgment-laden figures on the statement.
Chapter 10: On the Other Side
The right side of the balance sheet shows what the company owes and what belongs to the owners.
- Liabilities are split into current, due within a year, and long-term. The split drives the liquidity ratios that lenders watch.
- Owners’ equity combines the capital the owners paid in and the earnings retained in the business, less any dividends or distributions.
Chapter 11: Why the Balance Sheet Balances
The chapter explains why every transaction affects at least two accounts, so the two sides of the balance sheet always match.
- Every asset is financed by either a liability or equity. Any change on one side is matched on the other.
- Understanding why the sheet balances makes it possible to trace the effect of a business decision, such as buying equipment on credit, through the statements.
Chapter 12: The Income Statement Affects the Balance Sheet
The statements are connected. Profit or loss on the income statement flows into equity on the balance sheet, and many other entries move both at once.
- Net profit increases retained earnings. A loss reduces equity.
- Credit sales raise both revenue and receivables. Depreciation lowers both profit and the book value of fixed assets.
- The Part Three toolbox challenges the slogan that employees are the most valuable asset, since people never appear on the balance sheet. It also covers the line between an expense and a capital expenditure, which the WorldCom fraud abused at scale.
Chapter 13: Cash Is a Reality Check
Part Four opens by arguing that cash is the measure least affected by estimates and the one that decides survival.
- The chapter opens with a 2002 Fortune line: companies hit the skids for many reasons, but what ultimately kills them is running out of cash.
- Chip Conley, then CEO of Joie de Vivre Hospitality, told the authors that cash flow and burn rate are probably the two most important measures for a new entrepreneur.
- The chapter closes on the line that profits are not real money and cash is.
Chapter 14: Profit ≠ Cash (and You Need Both)
Using a hypothetical company called Sweet Dreams Bakery, the authors show how a profitable, growing business can run out of money.
- The bakery starts with ten thousand dollars and books twenty thousand dollars of sales in its first month. As sales grow, net profit moves from a two-thousand-dollar loss to an eight-thousand-dollar gain by month three. Its customers pay in sixty days while its suppliers want payment in thirty. The cash is gone after month one, and the bakery is thirty thousand dollars in the hole by month three.
- The reverse also happens. A company can show cash without profit by collecting deposits, selling assets, or borrowing, which can hide an unprofitable business.
Chapter 15: The Language of Cash Flow
The chapter explains the three sections of the cash flow statement and what each says about the business.
- Operating cash flow shows whether the core business generates or consumes cash. The authors treat it as the most important of the three.
- Investing cash flow shows spending on and sales of long-term assets. Financing cash flow shows borrowing, repayment, equity raised, and money returned to owners.
Chapter 16: How Cash Connects with Everything Else
The chapter reconciles net profit with the change in cash, first for a start-up and then for a more realistic company.
- Starting from net income, the reconciliation adds back noncash expenses and adjusts for changes in receivables, inventory, payables, and other balance sheet items.
- Working through the reconciliation shows exactly which management decisions turned profit into cash or trapped it on the balance sheet.
Chapter 17: Why Cash Matters
The authors argue that understanding cash flow gives an owner real power, because so many everyday decisions move it.
- Collection terms, inventory levels, the timing of capital purchases, and payment practices all change cash without necessarily changing profit.
- The Part Four toolbox compares cash accounting with accrual accounting and introduces free cash flow, operating cash flow minus capital expenditures, as the cash a company can actually use.
Chapter 18: The Power of Ratios
Ratios are presented as a window into what the statements are saying, whatever the company’s size or stage.
- Ratios are useful only in comparison: over time, against plan, or against similar companies.
- Because ratios are built from estimated numbers, they inherit the estimates. The chapter reviews accounting tricks that can flatter a ratio.
Chapter 19: Profitability Ratios
The profitability ratios measure the company’s ability to generate sales and control expenses. The authors remind readers that none of the inputs is fully objective.
- The chapter covers gross profit margin, operating profit margin, and net profit margin, each as a percentage of revenue.
- Return on assets shows how well the company uses what it owns. Return on equity shows the return to owners, including the effect of debt.
Chapter 20: Leverage Ratios
Leverage ratios show how much the company depends on borrowed money and how easily it can service that debt.
- Debt-to-equity compares total liabilities with owners’ equity. Lenders and investors read it as a measure of risk.
- Interest coverage compares operating profit with interest expense. It shows how much room the company has before debt payments become a problem.
Chapter 21: Liquidity Ratios
Liquidity ratios test whether the company can meet obligations coming due in the next year.
- The current ratio divides current assets by current liabilities.
- The quick ratio removes inventory from current assets, since inventory may not turn into cash quickly in a downturn.
Chapter 22: Efficiency Ratios
Efficiency ratios measure how well the company manages its assets and liabilities. The authors treat them as the ratios managers can influence most directly.
- Inventory days and inventory turnover show how long goods sit before sale. Days sales outstanding shows how long customers take to pay. Days payable outstanding shows how long the company takes to pay vendors.
- Property, plant, and equipment turnover and total asset turnover show how much revenue each dollar of assets produces.
- The Part Five toolbox asks which ratios matter most for a given business, shows the power of expressing costs as a percent of sales, and introduces the sustainable growth rate. Net margin times asset turnover times leverage gives return on equity, which is the growth rate a company can fund from retained earnings.
Chapter 23: The Building Blocks of ROI
Part Six opens with the time value of money, the principle that a dollar today is worth more than a dollar later.
- Future value and present value convert cash at different times into comparable terms.
- Opportunity cost and cost of capital set the hurdle a project must clear to be worth doing.
Chapter 24: Figuring ROI
The chapter applies those building blocks to capital expenditure decisions using three methods.
- Payback period counts how long it takes to recover the investment. Net present value discounts expected cash flows at the cost of capital. Internal rate of return finds the discount rate at which net present value is zero.
- The authors compare the methods. Payback is simple but ignores the time value of money. Net present value and internal rate of return are more rigorous but rest on cash flow forecasts that are themselves estimates.
- The Part Six toolbox gives a step-by-step guide to analyzing a capital expenditure.
Chapter 25: The Magic of Managing the Balance Sheet
Part Seven argues that managing working capital is one of the fastest ways for an owner to improve cash without raising money.
- The elements of working capital are cash, receivables, inventory, and the payables and other short-term liabilities that offset them.
- Small changes in these balances release or absorb large amounts of cash relative to profit.
Chapter 26: Your Balance Sheet Levers
The chapter focuses on the two levers most owners can move: collections and inventory.
- Days sales outstanding falls through clearer terms, prompt invoicing, credit checks, and steady follow-up on overdue accounts.
- Inventory falls through better forecasting, fewer slow-moving items, and closer coordination between sales and operations.
Chapter 27: Homing In on Cash Conversion
The chapter combines the levers into the cash conversion cycle, which measures how long cash is tied up between paying vendors and collecting from customers.
- The cash conversion cycle is days in inventory plus days sales outstanding minus days payable outstanding. Shortening it frees cash for growth.
- Payables are where, in the authors’ phrase, finance meets philosophy. In their sample company, stretching payables by one day adds about nineteen thousand dollars of cash. Stretching too far damages vendor relationships the business depends on.
- The Part Seven toolbox covers working with a banker and reading an accounts receivable aging report.
Chapter 28: Financial Literacy, Transparency, and Your Business's Performance
Part Eight turns from the owner to the organization. The authors argue that financially intelligent managers and financially literate employees make better companies.
- Managers who understand the numbers make better decisions, use resources more wisely, and, in the authors’ words, put their shoulder to the wheel instead of complaining about the owner.
- The authors cite a study by Edward Lawler and colleagues at the Center for Effective Organizations. It found that sharing business performance information and training employees to understand the business were linked to productivity, quality, profitability, and employee satisfaction.
Chapter 29: Financial Literacy Strategies
The chapter lays out practical tools for building financial literacy across the company.
- Three short, repeatable training sessions cover the income statement, cash flow and project management, and the balance sheet.
- Weekly numbers meetings focus on the two or three most important measures. Scoreboards and other visuals post the key numbers that remind people how the company makes money.
Chapter 30: Putting Financial Intelligence to Work
The closing chapter applies financial intelligence to the owner’s biggest choices about growth and ownership.
- The authors review paths to growth and the financial demands each places on the company.
- They discuss going public and the reporting discipline it requires. The Part Eight toolbox explains open-book management and the Sarbanes-Oxley Act.
- Open-book management, as the authors describe it, shares the financials with employees and teaches them what the numbers mean, so people feel part of the success and at risk for the failure.
About the Authors
Karen Berman is the founder and president of the Business Literacy Institute, which trains managers and employees in financial literacy. Joe Knight is a co-owner of the institute and has served as chief financial officer of Setpoint Systems and Setpoint Companies, a Utah manufacturer. Together they wrote Financial Intelligence: A Manager’s Guide to Knowing What the Numbers Really Mean, which this book adapts for entrepreneurs. John Case, a former senior writer at Inc. and author of Open-Book Management, co-wrote both books.
Their credibility comes from years of financial literacy training and from Knight’s experience as an operating CFO in a mid-sized company. The book is a teaching text, not a research study. Its claims about the effect of financial literacy on performance rest on a small number of cited studies and on the authors’ training experience.
Key Takeaways
1) The numbers are a reflection of reality, not reality itself.
The art of finance is the book’s central idea. Revenue recognition, depreciation, inventory costing, bad-debt reserves, and asset valuations all require estimates. A financially intelligent owner reads every statement knowing which numbers are judgment calls and asks what assumptions produced them.
- Accountants cannot know exactly how long equipment will last or how to allocate every cost.
- Changing an assumption can move reported profit with no change in the business.
- Cash is the number least affected by estimates.
2) Profit and cash are different measures, and a company needs both.
The income statement estimates whether the company’s activity was profitable. The cash flow statement shows whether it can pay its bills. The Sweet Dreams Bakery example shows a growing, profitable company running out of money because customers pay more slowly than suppliers must be paid.
- Growth consumes cash when receivables and inventory grow faster than payables.
- Operating cash flow is the first line to check on the cash flow statement.
- Cash without profit can hide an unprofitable business behind deposits, asset sales, or debt.
3) The three statements are one system.
Profit flows into equity. Credit sales create receivables. Depreciation reduces both profit and asset values. Reading any statement alone gives a partial picture. Reading them together shows how operating decisions turn into cash or get trapped on the balance sheet.
- The balance sheet balances because every asset is financed by debt or equity.
- The cash flow reconciliation starts with net income and adjusts for balance sheet changes.
- Tracing a single transaction through all three statements is the fastest way to learn the system.
4) Ratios turn statements into questions.
Profitability, leverage, liquidity, and efficiency ratios let an owner compare the company with its own past, its plan, and its peers. Because ratios are built from estimated numbers, they show where to look rather than giving a verdict.
- Efficiency ratios are the ones managers can move most directly.
- Return on equity sets the sustainable growth rate when all earnings are retained.
- Expressing costs as a percent of sales makes trends visible across periods of different size.
5) Working capital is the fastest cash lever an owner controls.
Collections, inventory, and payables tie up or release large amounts of cash relative to profit. The cash conversion cycle combines them into one number. In the authors’ sample company, one extra day of payables is worth about nineteen thousand dollars.
- The cash conversion cycle is inventory days plus receivable days minus payable days.
- Stretching payables has limits set by vendor relationships.
- Receivables aging and inventory reviews are routine tools for moving the cycle.
6) Capital decisions are judged on return over time, not on cost alone.
The time value of money underlies every investment decision. Payback, net present value, and internal rate of return give different views of the same project. Each depends on cash flow forecasts that are themselves estimates.
- Cost of capital and opportunity cost set the hurdle rate.
- Payback is simple but ignores timing.
- Net present value and internal rate of return are only as good as the forecasts behind them.
7) Financial intelligence pays off most when it spreads beyond the owner.
The book closes by arguing that literate employees make better daily decisions about rework, speed, service, and spending. Short training sessions, weekly numbers meetings, scoreboards, and open-book management put the numbers in front of people who can move them.
- Lawler’s research links information sharing and business training to performance.
- Two or three key measures are enough to anchor weekly meetings.
- Open-book management makes people feel part of the success and at risk for the failure.
Strengths and Limits
The book’s strength is accessibility without dumbing down. Short chapters, explanation boxes for terms, and simple sample statements let a nonfinancial founder learn the full set of statements and ratios in a few sittings. H. L. Vacher’s review in Numeracy praises this design. The art of finance theme sets the book apart from standard primers, because it teaches readers to distrust a number before relying on it. Tying cash, working capital, and return on investment to everyday management decisions, and ending with financial literacy across the company, connects accounting to running the business.
The limits come from scope and age. The book teaches GAAP statements as they stood in 2008. It gives little attention to subscription metrics, unit economics, or the intangible assets that drive value in many modern companies. Examples rely on hypothetical companies and two public company exercises, not on the private growth-stage businesses most readers run. The claims about financial literacy and performance rest on a small number of cited studies. The predictable failure is that an owner learns to read the statements but keeps managing from the P and L, because the book teaches how the numbers work more than which few numbers should run a specific business.
My Take
The diagnosis still holds. Many founder-CEOs in the five-to-fifty-million range cannot explain why profit and cash moved in opposite directions last quarter, and they defer to a CFO or outside accountant on questions they should own. This book closes that gap faster than any other I know. It is also the one I would hand to a leadership team, because it assumes no finance background and does not talk down.
How useful it is depends on the business model. In distribution, manufacturing, and project-based services, the balance sheet and working capital chapters are the most important part, because receivables and inventory are where the cash goes. In subscription software and other intangible-heavy businesses, the statements tell less of the story. Deferred revenue, customer acquisition cost, and retention matter more than anything on the balance sheet, and the book barely touches them.
The most credible outside objection comes from Baruch Lev and Feng Gu in The End of Accounting. They argue that GAAP statements have lost much of their usefulness because the assets that create value, such as brands, software, data, and customer relationships, mostly do not appear on the balance sheet. They report that earnings and book value explained most of market value in the 1950s and 1960s but only about half today. I think they are right for public companies and partly right for growth companies. Founders still need statement literacy to deal with banks, buyers, and their own cash, but it is the starting point, not the full dashboard.
What the book leaves incomplete is the management view. It teaches how the standard statements work but not how to restate them for running the company. Greg Crabtree’s Simple Numbers 2.0 fills that in, with gross margin as the top line, labor efficiency ratios, and a capital view of the balance sheet. Read Berman and Knight to learn the language. Read Crabtree to decide which numbers to run the company on.
Discussion Questions
For CEOs
- Which three numbers on our financial statements depend most on estimates, and who in the company makes those estimates?
- Over the last four quarters, did profit and operating cash flow move in the same direction, and if not, which balance sheet changes explain the gap?
- What is our cash conversion cycle today, and what would a ten-day reduction be worth in cash?
- Which ratios do our bank and any potential buyer watch, and where do we stand on each?
- How do we decide whether a capital expenditure is worth making, and what hurdle rate do we use?
- When do we recognize revenue on our largest contracts, and would a buyer’s accountant agree?
- How large are our one-time charges over the last three years, and are any of them actually recurring?
- If I left for a month, could my leadership team explain our monthly financials to the board without the CFO in the room?
For Teams
- Which line on the income statement does each of our roles influence most, and how?
- What decisions do we make every week that change cash without changing profit?
- What are our days sales outstanding and inventory days, and who owns moving each?
- Which two or three numbers should anchor a weekly numbers meeting for this team?
- Where do we see gross margin differ by product, service, or customer, and why?
- What would we change in our daily work if we saw the company’s operating cash flow every month?
- Which vendor payment practices help our cash, and which risk relationships we depend on?
- What part of the financial statements do we understand least, and who could teach it?
Practical Tools
1. Three-Statement Walkthrough
The book argues that the statements form one system and that tracing a transaction through all three is the fastest way to understand it. This exercise builds that understanding with the company’s own numbers instead of a textbook example. Use it when onboarding a new leadership team member, before a first meeting with a new lender or investor, or as the first session in a financial literacy program.
How it works:
- Pick three real transactions from last month: a credit sale, an equipment purchase, and a vendor payment.
- For each, show the effect on the income statement, the balance sheet, and the cash flow statement.
- Reconcile last month’s net income to the change in cash, line by line.
- Mark every number in the reconciliation that depends on an estimate.
- Ask each participant to explain one of the transactions back to the group.
Leaders can explain why profit and cash differ in a given month without help from finance. Questions in the monthly review shift from what a number is to why it moved.
2. Assumption Audit
The art of finance theme means that reported profit depends on choices about revenue recognition, depreciation, reserves, and capitalization. This audit makes those choices visible so the CEO knows which numbers to trust and which to question. Run it once a year with the outside accountant, before a sale process or financing, and whenever reported profit and cash diverge without an obvious reason.
How it works:
- List the company’s main accounting policies: revenue recognition, inventory costing, depreciation lives, bad-debt reserve, and capitalization threshold.
- For each, note who made the choice, when, and why.
- Estimate how much annual profit would change under a reasonable alternative.
- Identify any one-time charges taken in each of the last three years.
- Decide which policies to keep, which to change, and which to explain to lenders or buyers ahead of time.
The CEO can tell a buyer or banker which numbers involve judgment and why the chosen approach is reasonable. There are fewer surprises in due diligence.
3. Cash Conversion Review
Part Seven shows that collections, inventory, and payables are the fastest cash levers an owner controls. Combining them into the cash conversion cycle gives one number to manage. Run the review quarterly, and immediately when growth is consuming more cash than planned.
How it works:
- Calculate days in inventory, days sales outstanding, and days payable outstanding on a trailing basis.
- Combine them into the cash conversion cycle and compare it with the last four quarters.
- Calculate what one day of improvement in each component is worth in cash.
- Assign an owner and a target for each component.
- Review the receivables aging report and slow-moving inventory with the owners at each monthly meeting.
The cycle shortens or holds steady while revenue grows. Growth stops showing up as a surprise draw on the line of credit.
4. Capital Expenditure Screen
Part Six teaches payback, net present value, and internal rate of return, and warns that all three depend on forecasts. This screen applies them to real proposals and makes the assumptions explicit. Use it for any capital request above a threshold the CEO sets, and for comparing competing proposals in the annual plan.
How it works:
- Set the company’s hurdle rate based on its cost of capital and opportunity cost.
- For each proposal, list the expected cash outflows and inflows by year.
- Calculate payback, net present value at the hurdle rate, and internal rate of return.
- Run a downside case with lower inflows and later timing.
- Approve, defer, or reject, and record the assumptions so actual results can be compared later.
Proposals arrive with cash flows and assumptions already laid out. A year later, the team can see which forecasts held and adjust how they estimate.
5. Ratio Dashboard
The book presents ratios as a window into the statements and recommends choosing the few that matter most for a given business. A small set of ratios, tracked over time, gives the leadership team a shared view of financial health. Build it after the leadership team has completed the three-statement walkthrough, and revisit it annually.
How it works:
- Pick one or two ratios from each family: profitability, leverage, liquidity, and efficiency.
- Calculate each for the last eight quarters to establish a trend.
- Add the sustainable growth rate, calculated as return on equity under full retention.
- Agree on the range for each ratio that would trigger a discussion.
- Review the dashboard monthly and record the explanation for any ratio outside its range.
Leaders spot a liquidity or efficiency problem quarters before it reaches the bank balance. The growth plan is tested against what the company can actually fund.
6. Company Literacy Program
Part Eight argues that financial intelligence pays off most when it spreads beyond the owner. It recommends short training sessions, weekly numbers meetings, and scoreboards. This program puts those recommendations into practice. Start it once the leadership team is fluent in the statements, and expand it gradually toward open-book management.
How it works:
- Run three short sessions for managers: the income statement, cash flow and project management, and the balance sheet.
- Choose the two or three measures that best show how the company makes money.
- Hold a weekly numbers meeting on those measures with each manager reporting their part.
- Post the measures on a visible scoreboard updated every week.
- After two quarters, decide which additional teams to train and how much more of the financials to share.
Managers can say how their decisions move the key measures. Employees outside management start asking how their work affects the scoreboard.
Further Reading
- H. L. Vacher’s review in Numeracy, which describes the book’s structure, exercises, and quantitative literacy themes in detail.
- Harvard Business Publishing listing for the book, with the publisher’s description.
- The CPA Journal on Baruch Lev and Feng Gu’s The End of Accounting and the declining relevance of financial statements.
- CFA Institute’s response to Lev’s argument, for the case that financial statements still matter.
- Great Game of Business, the organization built on Jack Stack’s open-book management, which the book’s final part draws on.
Share This Review

Bruce Eckfeldt is a business coach and strategic advisor to founder-CEOs of growth-stage companies, a former Inc. 500 CEO, and the author of Springboard. More book reviews →
These summaries present Bruce Eckfeldt’s analysis of business and leadership books for founder-CEOs and leadership-team members of growth companies. Each one identifies the ideas most relevant to decision quality, strategy, and leadership capacity, notes where the evidence is weak, and suggests practical ways to test what is worth testing. All ideas, stories, and quotations belong to the original author and to the people they cite. The assessments and recommendations are Bruce’s. It is a companion to the book, not a substitute for reading it.
To learn more about Bruce’s programs, request other book summaries, or get in touch, contact booksummaries@eckfeldt.com.
Get the Next Review.
A new book review lands in Better, Faster, my weekly newsletter for founder-CEOs, along with one practical essay and questions for your team.