Profit Per X: Find the One Ratio That Runs Your Economic Engine
Standard financial measures can leave each function optimizing a different outcome, pulling strategy away from daily choices. Choose one profit ratio tied to a unit that drives your economics, then use it as a shared test for decisions and track it consistently.
By Bruce Eckfeldt

TL;DR
Profit Per X finds the one ratio, profit divided by a single unit, that shows how your business really makes money. Most teams watch the same revenue and margin numbers as their competitors, so every function ends up optimizing something different. You list ten candidate units, test how each would change your decisions, and pick one you can measure. You walk away with a KPI the whole team can use as a shared test for decisions.
The Tool
Most leadership teams I work with watch the same numbers. Revenue. Gross margin. EBITDA. Their competitors watch the same numbers too. That’s the problem. When everyone measures the business the same way, everyone ends up optimizing it the same way, and the strategy starts to look like everyone else’s.
Profit Per X asks a sharper question. If you could pick one ratio, profit divided by some unit, and improve it every year, which unit would change your business the most? Jim Collins called this the economic denominator. In Good to Great, he found that each company that made the leap had one at the center of its Hedgehog Concept. Verne Harnish later put it on the One-Page Strategic Plan, right next to the BHAG.
I learned this one by running it. At my agency, our unit of delivery was a developer day. We placed senior developers inside client organizations to help with process design, coaching, team structure and change management. Every decision came back to one question: what margin were we earning per developer day? Pricing, staffing, which clients we took, which work we turned down. That ratio told us more than any line on the P&L.
Why the Denominator Changes the Decisions
The X you pick decides what the company optimizes. That’s the whole point of the tool.
Collins tells the Walgreens story. A drugstore chain’s natural measure is profit per store. Run on that, you build fewer stores in cheaper locations and squeeze each one. Walgreens switched to profit per customer visit. That pointed it toward dense, convenient corner locations, even when its own stores drew customers from each other. Same company, same industry. A different denominator produced a different strategy.
Without one shared X, every function picks its own. Sales chases revenue per rep. Operations chases utilization. Finance chases margin percent. Each number looks fine on its own, and the company drifts. A single ratio gives the leadership team a common test for every big choice: does this raise our profit per X, or not?
The cost of skipping this is quiet but real. You end up with a strategy on the wall that never shows up in daily decisions.
How Profit Per X Works
The tool is a simple ratio. A profit measure on top. A unit that flows through your business on the bottom.
The numerator is usually the easy part. Collins framed it as profit. Harnish is looser. He says the numerator can be profit, revenue or gross margin, and that the denominator is what matters. My default is gross margin, or contribution margin if you track it. It sits close to the unit, it moves when the unit’s economics move, and it avoids the overhead allocations that make net profit per X noisy. Revenue on its own is the one I’d avoid. More on that below.
The denominator is the strategic choice. It should reflect how your business actually makes money and how it will scale. Some common candidates by business model:
- Professional services: billable hour, consultant day, project, client.
- Product companies: unit sold, customer, product line.
- Membership and subscription: member, subscriber, renewal.
- Locations: store, visit, square foot.
- Asset-heavy businesses: truck, machine, room night, plane.
The key insight is this. The right X isn’t the one with the best number. It’s the one that changes how your team sees its priorities. When a team lands on the right denominator, you can feel the conversation shift. People start questioning work they used to take for granted.
Profit Per X Is Not Your Widget
If you run Metronomics or the 3HAG, you already work with widgets. They sound similar. They do different jobs.
Here’s the short version. Profit Per X tells you which unit to make better. The widget tells you how many units to plan for. One is analysis. The other is a forecast.
Profit Per X is a ratio built from actual results. It looks at the business as it runs today and asks where the money really comes from. You use it to judge strategy and operations: which customers, offers, locations or ways of working earn the most per unit. There is one Profit Per X for the whole company.
The widget comes from Shannon Susko’s 3HAG Way. It’s a count of what flows through the business: leads, proposals, projects, units, customers. Metronomics forecasts the widgets first, then converts them into dollars, month by month, to test whether the three-year plan holds up. A company can have several widgets, one for each critical function.
The two fit together when they share a unit. Profit equals the number of widgets times the profit per widget. At my agency, a forecast would count how many developer days we’d deliver next quarter. Profit Per X asked what margin each of those days earned. Same unit. Two different questions.
Watch for teams that blur the two. They name their widget and call it their Profit Per X. Then they track a count when they meant a ratio, and volume growth hides falling profit per unit.
When to Use It and When Not To
Profit Per X earns its place when a team has a strategy and needs a way to make it drive day-to-day choices. It’s a tool for implementing strategy, or for pulling execution back in line with it. I usually bring it in later in an engagement, once some of the strategic pieces are in place. A defined core customer is the minimum. A validated flywheel helps a lot, because the X is often the unit the flywheel spins on.
It also pairs well with long-range goals. Harnish makes the point that the unit of your BHAG should match the unit of your Profit Per X. Southwest is the clean example, as you’ll see below. When the long-range goal and the economic ratio share a unit, the team can see how today’s choices add up to the big target. If you already have a BHAG, test your candidates against it. If the units don’t line up, one of them probably needs work.
Skip it when core operations aren’t stable yet. If the team is still fighting fires on delivery or cash, a strategic ratio is a distraction.
Skip it, for now, when you can’t measure the candidates. A Profit Per X that can’t be tracked won’t change anyone’s behavior. If the data isn’t there, fix that first.
Working Through the Worksheet
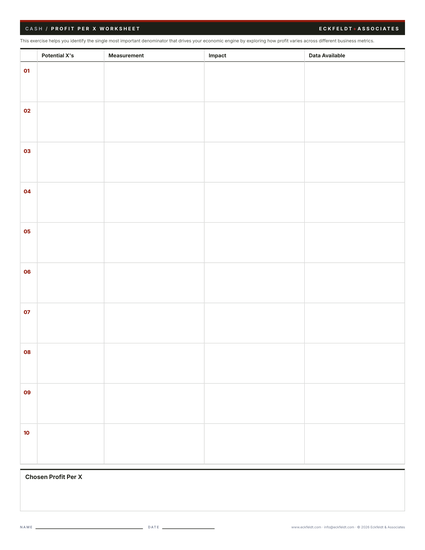
The worksheet has ten rows and four columns, and a box at the bottom for your final choice. Work it in order.
- List ten Potential X’s. Push past the obvious three. Customer, employee and location come up every time. Keep going: visit, transaction, project, hour, contract, route, member, product line. The ones you list at number eight and nine are often the interesting ones.
- Write the Measurement. For each candidate, write the actual formula. Which margin, divided by which count, over what period. Vague measures hide weak candidates.
- Name the Impact. Ask what you would do differently if you ran the business on this ratio. What would you do more of? Less of? What would you stop? This column is where the thinking happens.
- Check Data Available. Can you measure it today, and how often? Bring reasonably good numbers to test the top candidates. They don’t need to be final. The point is to check whether the data exists to make the X work.
- Discuss and pick one. Look across the Impact column. Watch which candidate changes the conversation. That’s usually your answer, even when another one has a better number. If two candidates tie, pick the one you can measure more often.
- Fill in the Chosen Profit Per X box. Name the ratio and write one line on why it won.
- Turn it into a KPI. Put it on the dashboard and review it in your meeting rhythm. If it lives only in a planning document, it won’t shape any decisions.
Examples
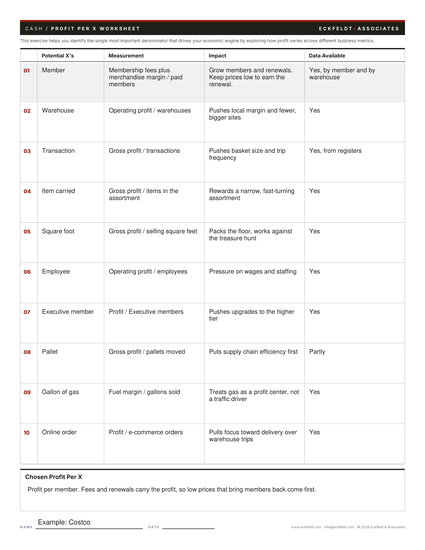
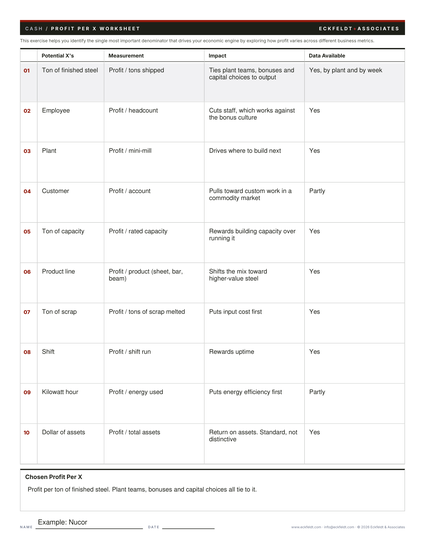
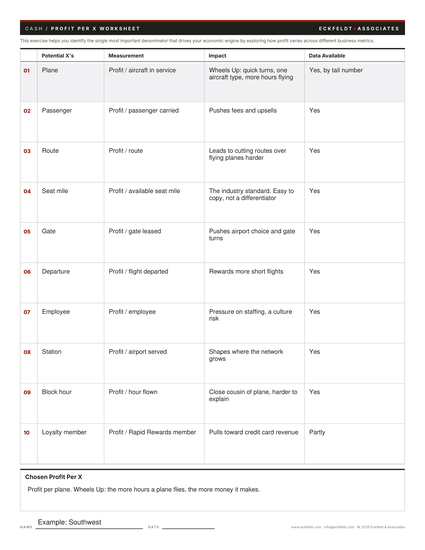
Here are three worked examples, each on the worksheet. The candidate lists and impact notes are illustrative. They show how a leadership team might work through the tool. The chosen X in each case comes from the public record or, for Costco, from a reading of its public results.
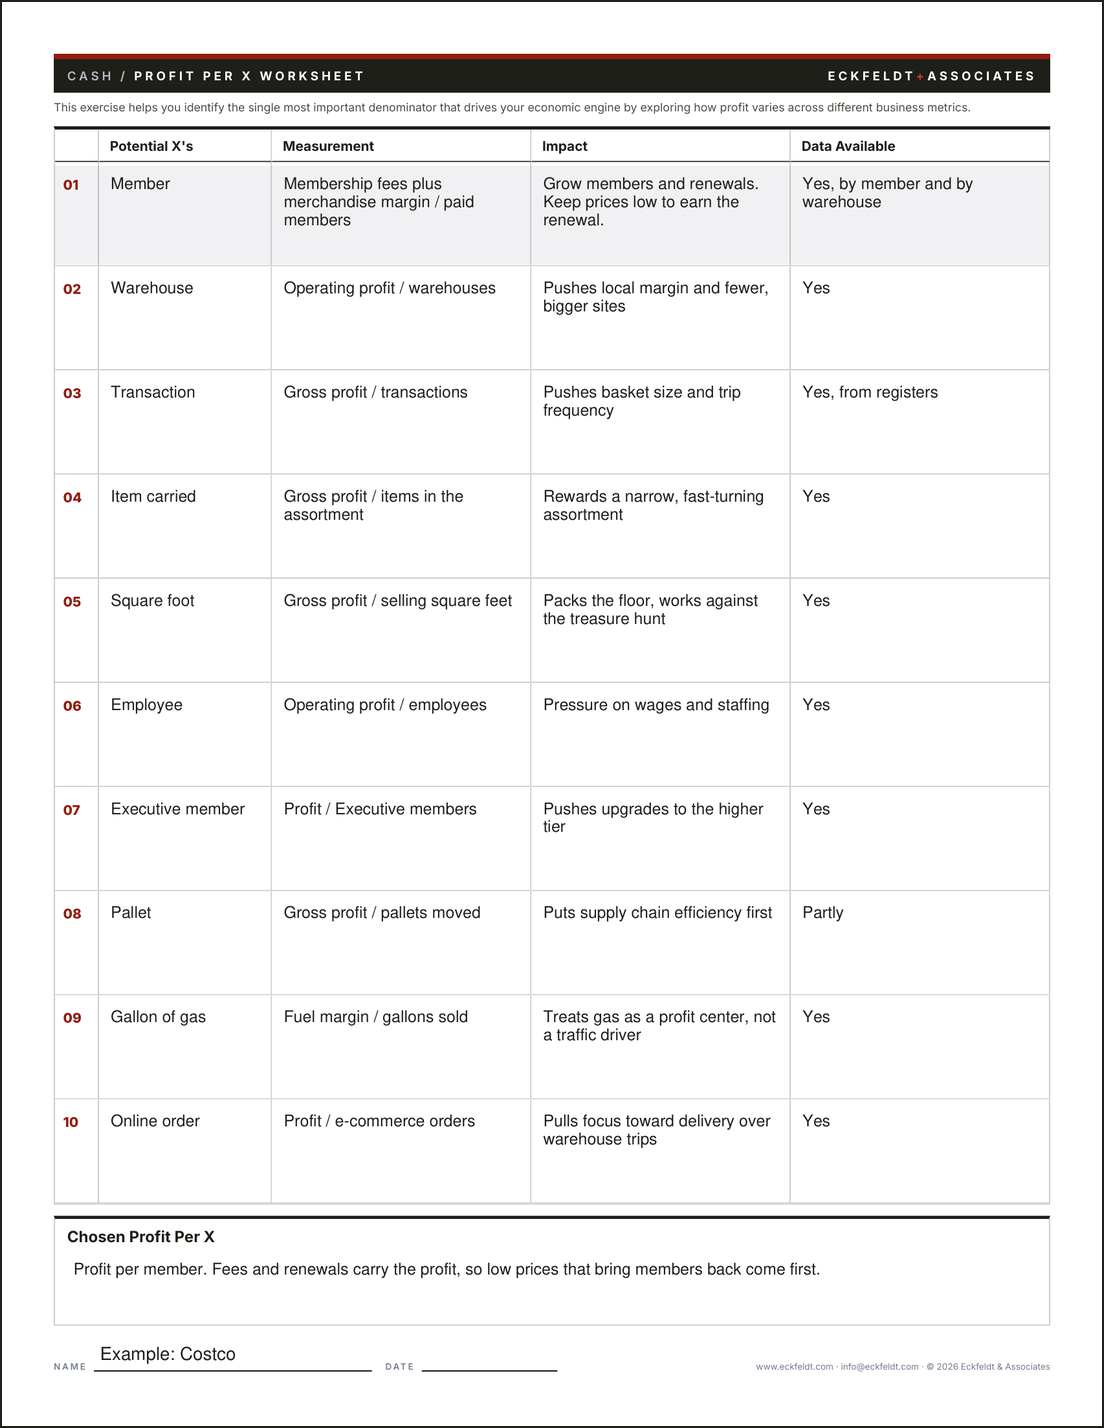
Costco: profit per member
Costco runs its merchandise at thin margins on purpose. The profit comes from members who keep paying to come back. In fiscal 2025, membership fees made up about half of its operating income, and renewal ran above 92 percent in the U.S. and Canada. That’s why profit per member is the ratio that explains the business. It explains why prices stay low, why the assortment stays narrow, and why renewals get watched so closely. Costco has never named this as its denominator. It’s our reading of the numbers.
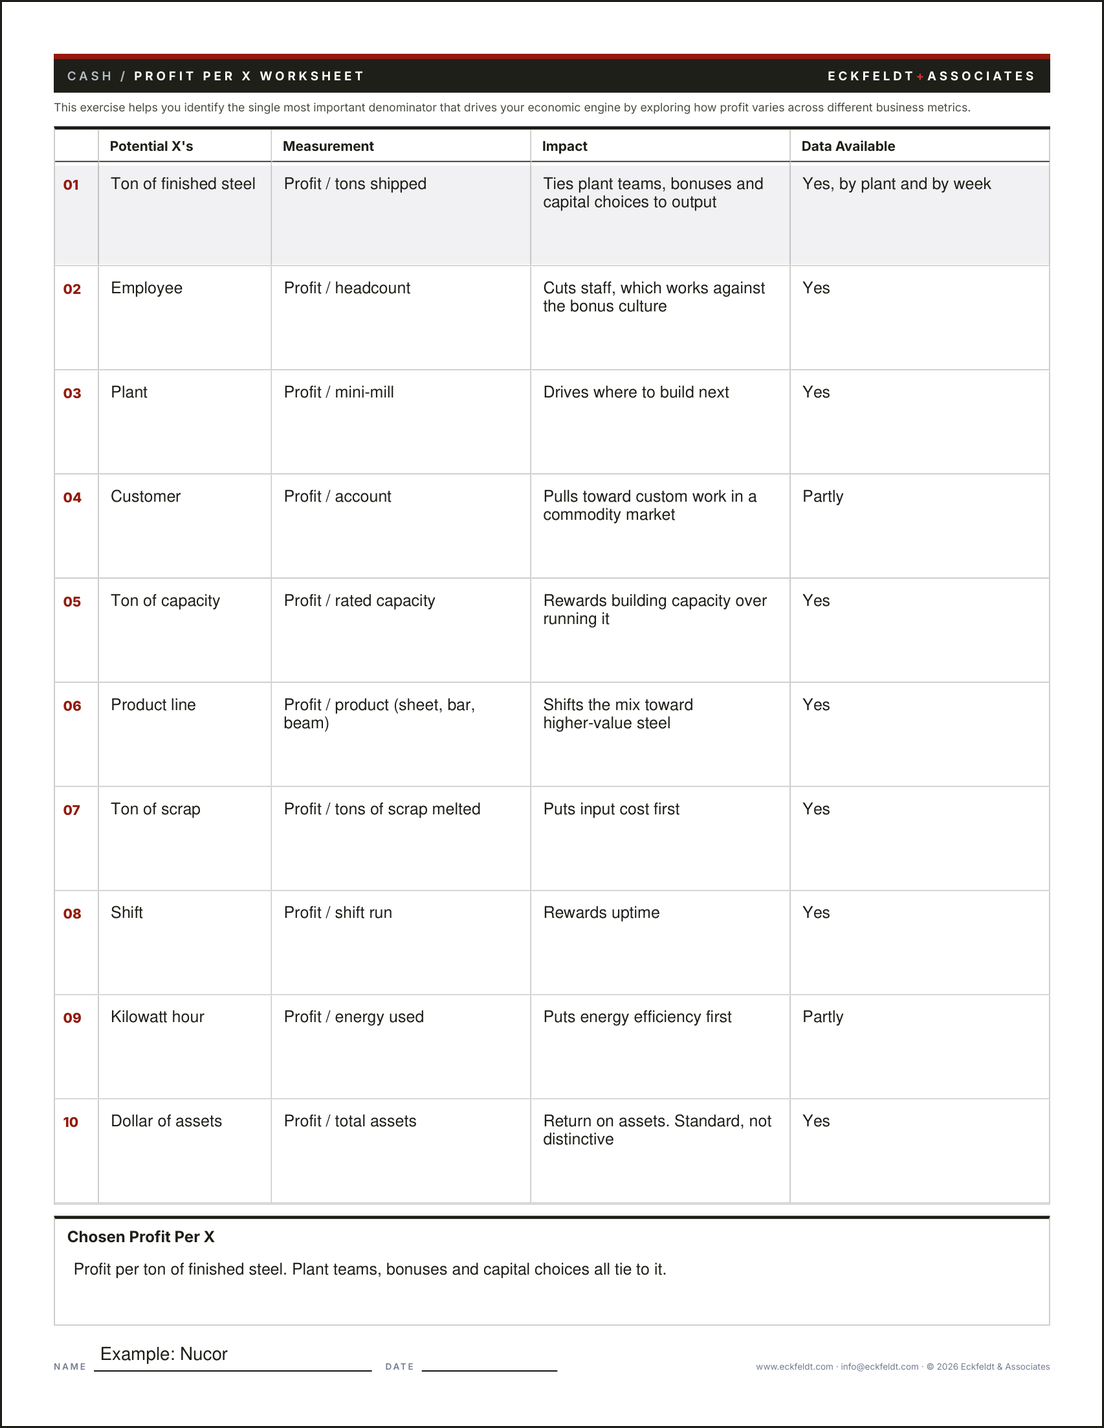
Nucor: profit per ton of finished steel
Steel is a commodity business with brutal price competition. Collins found that Nucor organized around profit per ton of finished steel. That one ratio tied plant teams, bonuses and capital choices to output. Look at the alternatives on the sheet. Profit per employee would have pushed headcount cuts that fought the bonus culture. Profit per customer would have pulled Nucor toward custom work in a market that rewards efficiency.
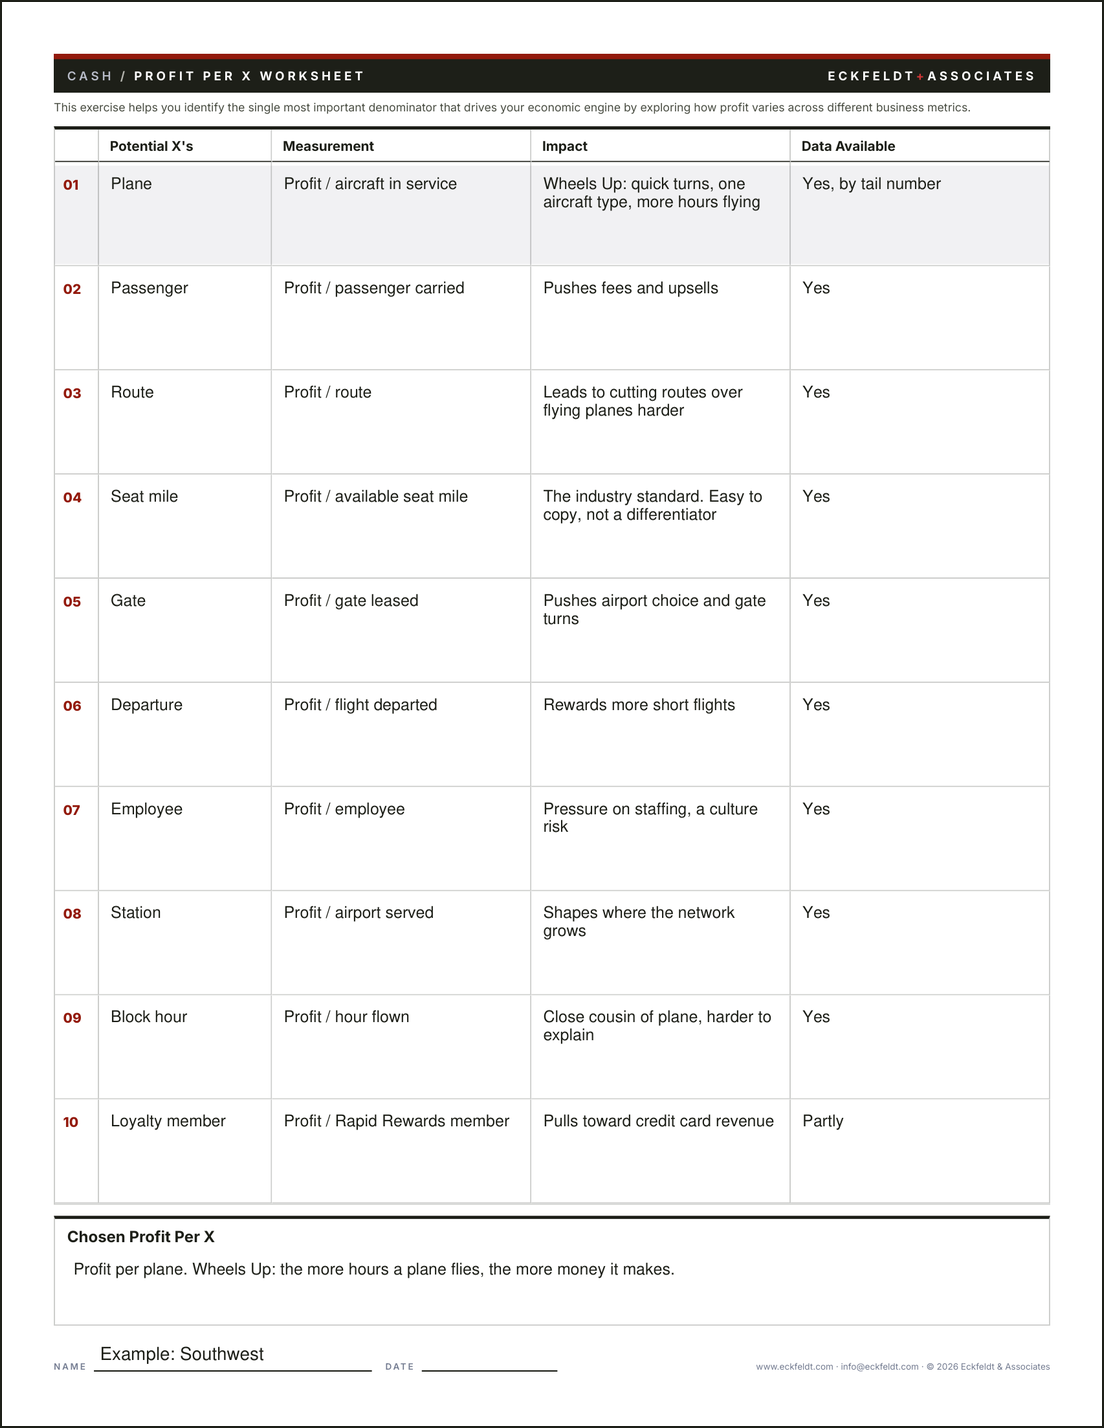
Southwest: profit per plane
Most airlines measure revenue per available seat mile. Southwest chose profit per plane. Its internal shorthand was Wheels Up: the more time a plane spends in the air, the more money it makes. That drove quick turns, one aircraft type and point-to-point routes. Its BHAG used the same unit, 346 planes in the air by 2010. The ratio has outlasted big product changes too. In 2025 Southwest added bag fees and assigned seating. It also added red-eye flights and cut turn times, both to fly each plane more.
More X’s worth knowing
A few more cases show the range:
- Walgreens, profit per customer visit. The classic Collins case, covered above. It moved the chain from profit per store to dense, convenient locations.
- Gillette, profit per customer. Collins found that Gillette looked past profit per division to profit per customer, which reflected the economics of repeat purchases.
- A car wash, profit per membership customer. One Scaling Up coach describes a client who found that members on unlimited monthly plans drove the business. The owner rebuilt the model around growing them.
- My agency, margin per developer day. Every pricing, staffing and client decision ran through that one number.
Where This Breaks Down
These are the patterns I see when teams work through Profit Per X.
The Revenue Ratio. If I were watching your team, I’d check the numerator first. Revenue per X is tempting because the data is easy to get. But revenue per customer can rise while margin per customer falls. A ratio that rewards unprofitable growth will steer you the wrong way. Use a margin.
The Industry Default. Teams often land on the number their whole industry already tracks. Revenue per seat mile in airlines. Revenue per square foot in retail. These are easy to copy and they won’t differentiate you. If your X matches every competitor’s, keep looking.
The Unmeasurable X. Sometimes the best idea on the sheet is one the team can’t track. It sounds right in the room and never changes behavior after. Check the Data Available column honestly. If you can’t measure it at least monthly, it won’t drive decisions.
The Best-Looking Number. I watch for the team that picks the X that makes this quarter look good. The right X is the one that changes how the group sees its priorities. If the choice doesn’t make anyone uncomfortable, it probably isn’t doing its job.
Calling Your Widget Your X. A team that runs the 3HAG will sometimes name its widget and call it done. That’s a count, not a ratio. Volume can grow while profit per unit slides. Keep both, and keep them separate.
Set and Forget. A denominator is a strategic bet, and markets move. Walgreens’ profit per customer visit powered decades of growth. It didn’t protect the company when reimbursement pressure, theft and rising costs hit retail pharmacy. Sycamore Partners took it private in 2025. Revisit your X with your annual strategy, and ask whether it still describes how you make money.
Your Next Step
Download the worksheet and the three examples. Start alone. List your ten candidates and fill in every column before you look at anyone else’s.
Then run it with your leadership team. Have each person bring a list, build one sheet of ten together, and spend most of the time on the Impact column. Give it a full working session, not a slot at the end of a meeting. The first pass usually produces the obvious candidates. The second pass, after people have argued about impact, is where the real denominator shows up. That debate is the work. It forces people to say out loud how they think the business makes money, and the gaps between their answers are worth finding.
When you’ve picked your X, put it on the dashboard and review it every month. That’s how a ratio on a worksheet becomes a way of running the business.
Downloads
- Worksheet, PDF, 1 page Profit Per X Worksheet
List ten candidate X's, test each one's measurement, impact and data, then record the one you choose.
- Example, PDF, 1 page Example: Costco
Profit per member. Fees and renewals carry the profit, so low prices that bring members back come first.
- Example, PDF, 1 page Example: Nucor
Profit per ton of finished steel. One ratio ties plant teams, bonuses and capital choices to output.
- Example, PDF, 1 page Example: Southwest
Profit per plane. Wheels Up: the more hours a plane flies, the more money it makes.
Get a Free Worksheet Review.
Send me your Profit Per X worksheet and your notes, and we will go through it together on a free 30-minute call: what your answers show, what to work on first, and whether coaching would help.
Request a Free Worksheet Review
This is a free 30-minute call with me to go through your Profit Per X worksheet. Send it below with a few notes on where you got stuck or what you want a second opinion on. I read everything before we talk, so the call starts from your answers, not the basics. We look at what your answers show, where they are thin or unclear, and what to work on first. You leave with a clear next step, whether or not we work together after. There is no cost and no sales pitch.
- Send your worksheet. Attach it below with your notes.
- I read it and reply. You get a few times to talk.
- We meet for 30 minutes. Free, focused on your answers, with a clear next step.
Your worksheet goes only to me. I read every request myself and reply with times to talk.
Use It With These.
Playbook tools rarely work alone. Each of these connects to Profit Per X, either as a step that comes before it or as the place its answer goes next.

Flywheel
The X is often the unit your flywheel spins on. Map the engine first, then find the ratio that measures it.
Open the toolCore Customer
The right X reflects who you serve. Define the core customer before you test denominators.
Coming to the PlaybookOne Page Strategic Plan
Profit Per X sits next to the BHAG on the plan. The two should share a unit.
Coming to the PlaybookThe Coach Behind the Playbook.
The Playbook is the set of tools I use with leadership teams, written up so you can run them yourself.

Bruce Eckfeldt is a business coach and strategic advisor to founder-CEOs of growth-stage companies and a former Inc. 500 CEO. He writes a column for Inc.com, hosts the From Angel to Exit podcast, and is the author of Springboard, a founder's guide to selling your company. Connect with him on LinkedIn.
Keep Going.
More on this topic from the Inc.com column, Field Notes, and The Playbook.

Having a Goal Is Not the Same as Having a Strategy. Here's Why
Goals without a strategy go nowhere. Strategy defines the path that gets you to the goal.
Read the article
The 5 Most Common Mistakes Leaders Make When Crafting a Business Strategy
The common strategic planning mistakes that block clear execution, and how to avoid them.
Read the article
Master the Art of Quarterly Planning With These 7 Steps
A disciplined quarterly planning process aligns the team and speeds up strategic execution.
Read the article
Why Most Business KPIs Hide Where Your Profit Actually Comes From
Most business KPIs show how much profit you made, not where it came from. Why profit by customer, delivery, or service line stays invisible, and how to put it in front of the people making daily decisions.
Read the post
Flooring It: Why Pushing Harder on a Wobbly Flywheel Makes Growth Worse
Stalled growth tempts founder-CEOs to add salespeople and marketing spend. When the broken step sits two steps down the business flywheel, that push makes things worse. How to find the wobble and fix it first.
Read the post
Strategic Thinking Is Not Strategic Action. The Difference Is Where Most Leadership Teams Quietly Fail.
Most leadership teams have built strategic thinking. Few have built strategic action, the ability to make good calls together while the market moves. Where the gap shows up and how to close it.
Read the postGet the Next One.
Every new post and playbook lands in Better, Faster, my weekly newsletter for founder-CEOs, along with questions for your team and a book worth reading.